
DEMONSTRATION DATA2024 sample season
Live Crop Intelligence:
See Nitrogen in Real-Time
Follow one sample farm's nitrogen decisions through a complete season.
Farm profile · sample
Prairie View Farm
Story County, Iowa
Corn · 320 acres
Season start · May 6, 2024
JM
Jordan Miller
Demonstration farmer profile
Soil nitrate trend
Days since planting
Nitrate ppm
Hover or focus on data points for weekly readings. Rainfall and temperature appear in the table below.
Current nitrate
19 ppm
Last update
Jun 17, 2024
7-day forecast
Optimal — no N needed
Weekly field note · May 27
Nitrogen response in progress
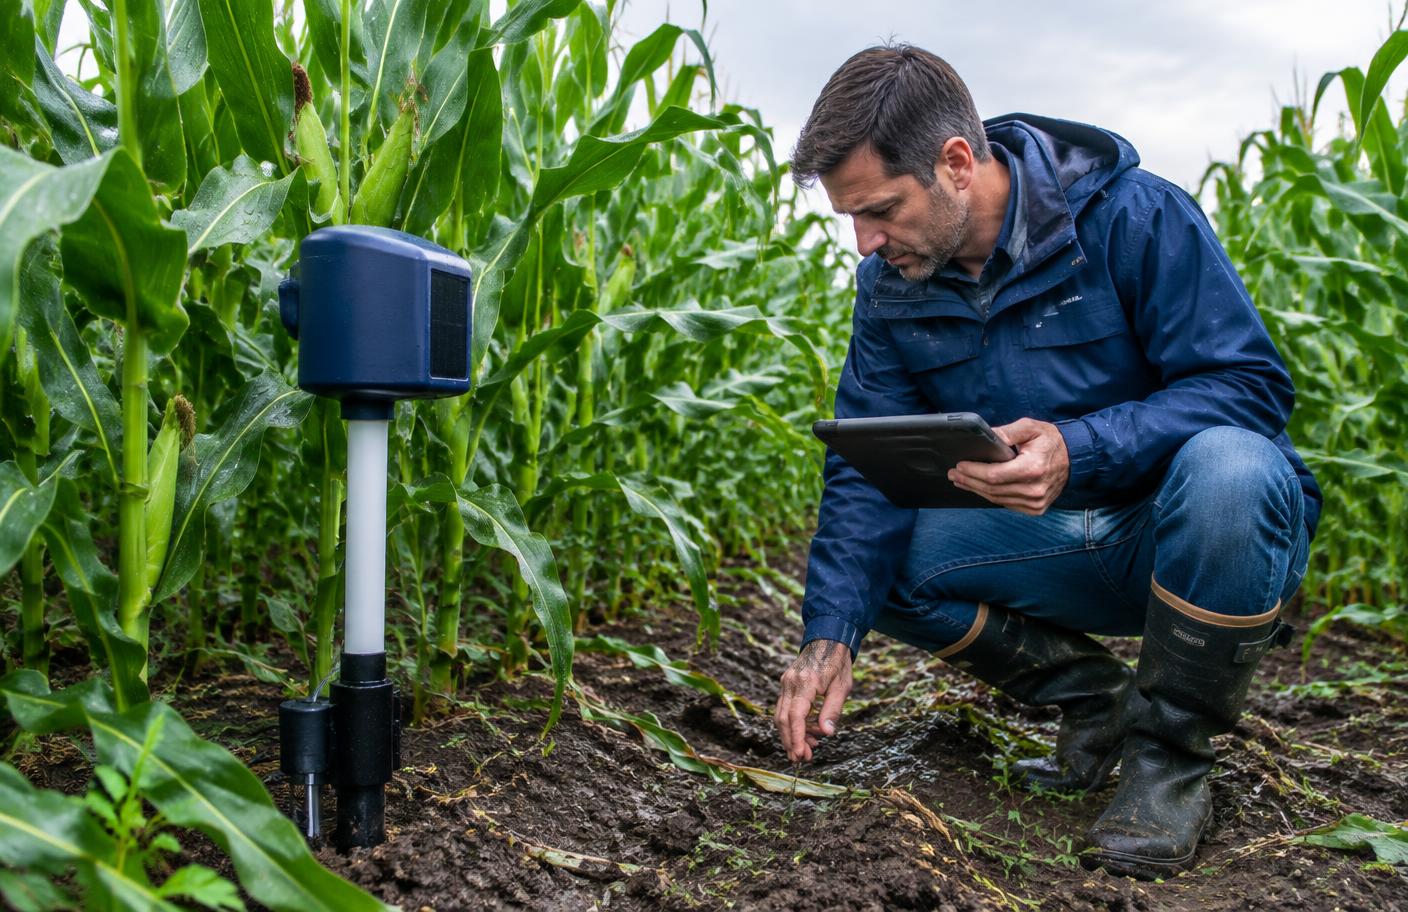
Soil levels were dropping after rainfall. The sample farmer applied 80 lbs N/acre. The sensor registered the expected response within five days.
6 mm rain22°C
Season record
Historical data
| Week | Nitrate (ppm) | Rainfall (mm) | Temperature (°C) | Action Taken |
|---|---|---|---|---|
| May 06 | 24 | 8 | 17 | Sonda deployed |
| May 13 | 22 | 4 | 19 | Monitored |
| May 20 | 18 | 32 | 20 | Leaching watch |
| May 27 | 15 | 6 | 22 | Applied 80 lbs N/ac |
| Jun 03 | 23 | 2 | 24 | Response confirmed |
| Jun 10 | 21 | 12 | 25 | Monitored |
| Jun 17 | 19 | 7 | 27 | No application |
All farm names, people, dates, and measurements on this page are illustrative demonstration data.
Bring this clarity to your field